
ED506- EDUCATIONAL STATISTICS
What is Educational Statistics?
Incorporation of computer usage in the principles and practices of psychological and educational assessment. Inferential and descriptive statistics, formal and informal methods of assessment, designing assessment programs, interpretation of test results, and analysis of research results are explored
Incorporation of computer usage in the principles and practices of psychological and educational assessment. Inferential and descriptive statistics, formal and informal methods of assessment, designing assessment programs, interpretation of test results, and analysis of research results are explored
Learning Outcomes
- Identify the difference between descriptive and inferential statistics.
- 2. Utilize statistical software to generate measures of central tendency and variability.
- 3. Utilize statistical software to generate and interpret graphical displays of data.
- 4. Identify differences between null, directional, and nondirectional hypotheses.
- 5. Utilize statistical software to compute and interpret z-scores.
- 6. Utilize statistical software to conduct parametric analyses (Independent Samples T-Test, T-Test for Dependent Means, One-way Analysis of Variance with Post Hoc Tests, Testing of Correlations)
- Identify scales of measurement.
- 8. Utilize statistical software to conduct nonparametric analyses (Chi-Square Tests).
- 9. Identify the appropriate statistical analysis for a research situation. 10. Present and interpret the results of statistical analyses within the context of a research situation.
Course Objectives
- Identify the difference between descriptive and inferential statistics.
- Utilize statistical software to generate measures of central tendency and variability.
- Utilize statistical software to generate and interpret graphical displays of data.
- Identify differences between null, directional, and nondirectional hypotheses.
- Utilize statistical software to compute and interpret z-scores.
- Utilize statistical software to conduct parametric analyses (Independent Samples T-Test, T-Test for Dependent Means, One-way Analysis of Variance with Post Hoc Tests, Testing of Correlations)
- Identify scales of measurement.
- Utilize statistical software to conduct nonparametric analyses (Chi-Square Tests).
- Identify the appropriate statistical analysis for a research situation. 20. Present and interpret the results of statistical analyses within the context of a research situation.
What is my role for this course?
To create numerous data files and outputs from SPSS software. SPSS Statistics is a software package used for interactive, or batched, statistical analysis. Long produced by SPSS Incorporated.
SPSS is short for Statistical Package for the Social Sciences, and it’s used by various kinds of researchers for complex statistical data analysis. The SPSS software package was created for the management and statistical analysis of social science data. It was originally launched in 1968 by SPSS Inc., and was later acquired by IBM in 2009.
Officially dubbed IBM SPSS Statistics, most users still refer to it as SPSS. As the world standard for social-science data analysis, SPSS is widely coveted due to its straightforward and English-like command language and impressively thorough user manual.
SPSS is used by market researchers, health researchers, survey companies, government entities, education researchers, marketing organizations, data miners, and many more for processing and analyzing survey data, such as you collect with an online survey platform like Alchemer.
Most top research agencies use SPSS to analyze survey data and mine text data so that they can get the most out of their research and survey projects.
Core Functions of SPSS
SPSS offers four programs that assist researchers with your complex data analysis needs.
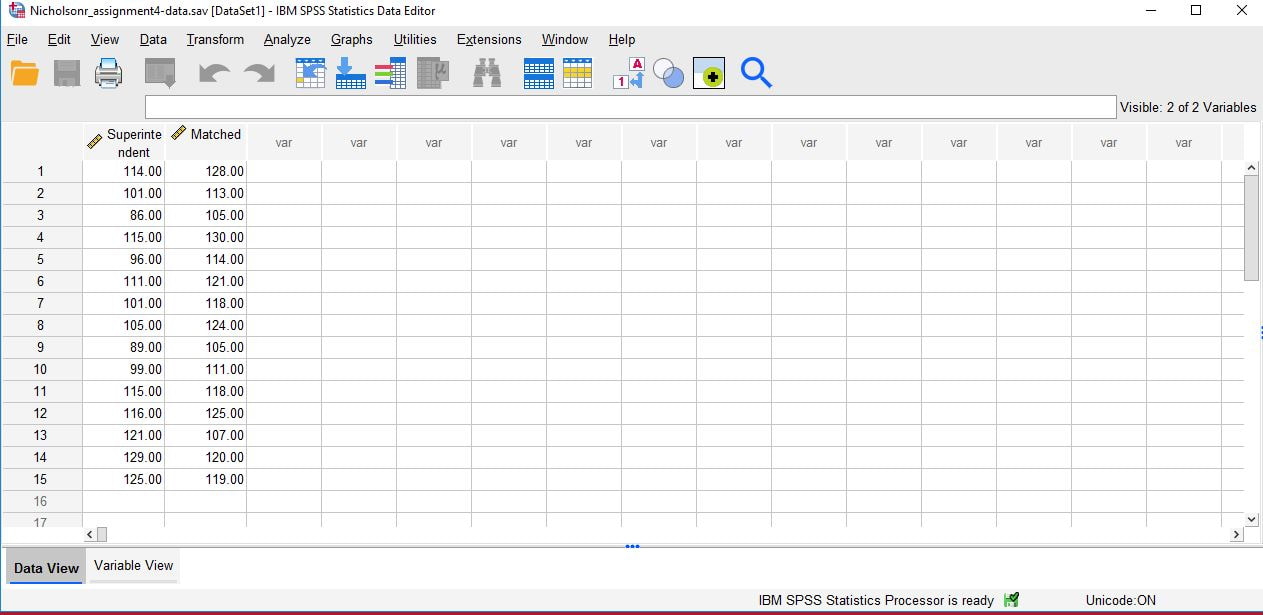
Here are a few examples of SPSS data and output files from this class.
|
Example of SPSS data file.
|
Example of SPSS out file constructed from the data file.
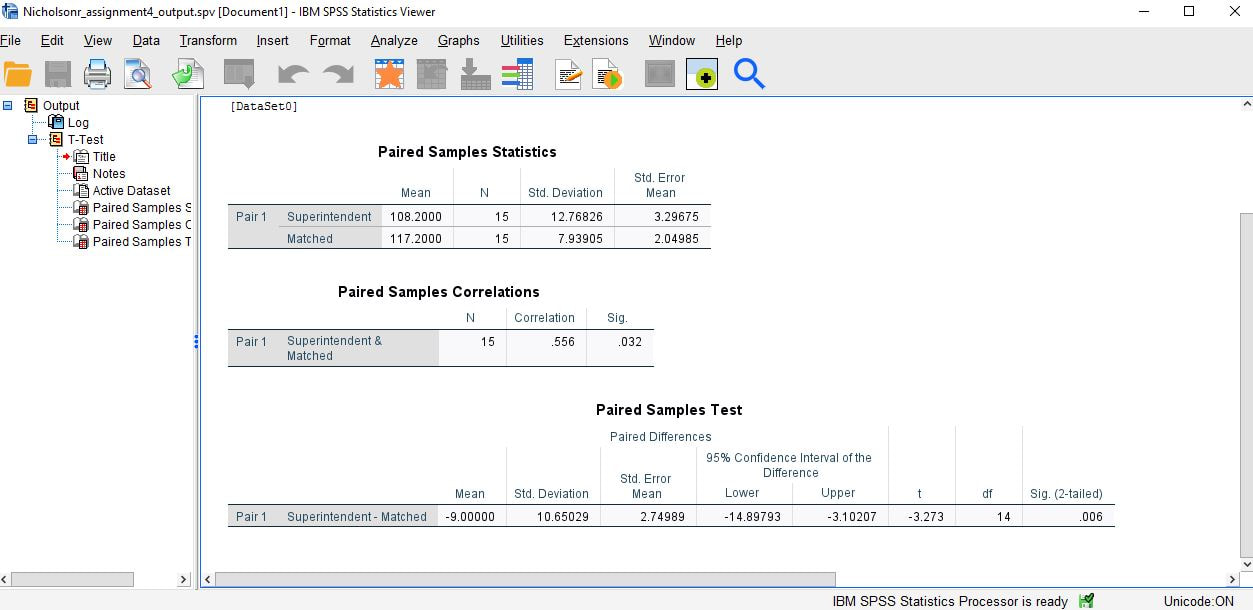
|